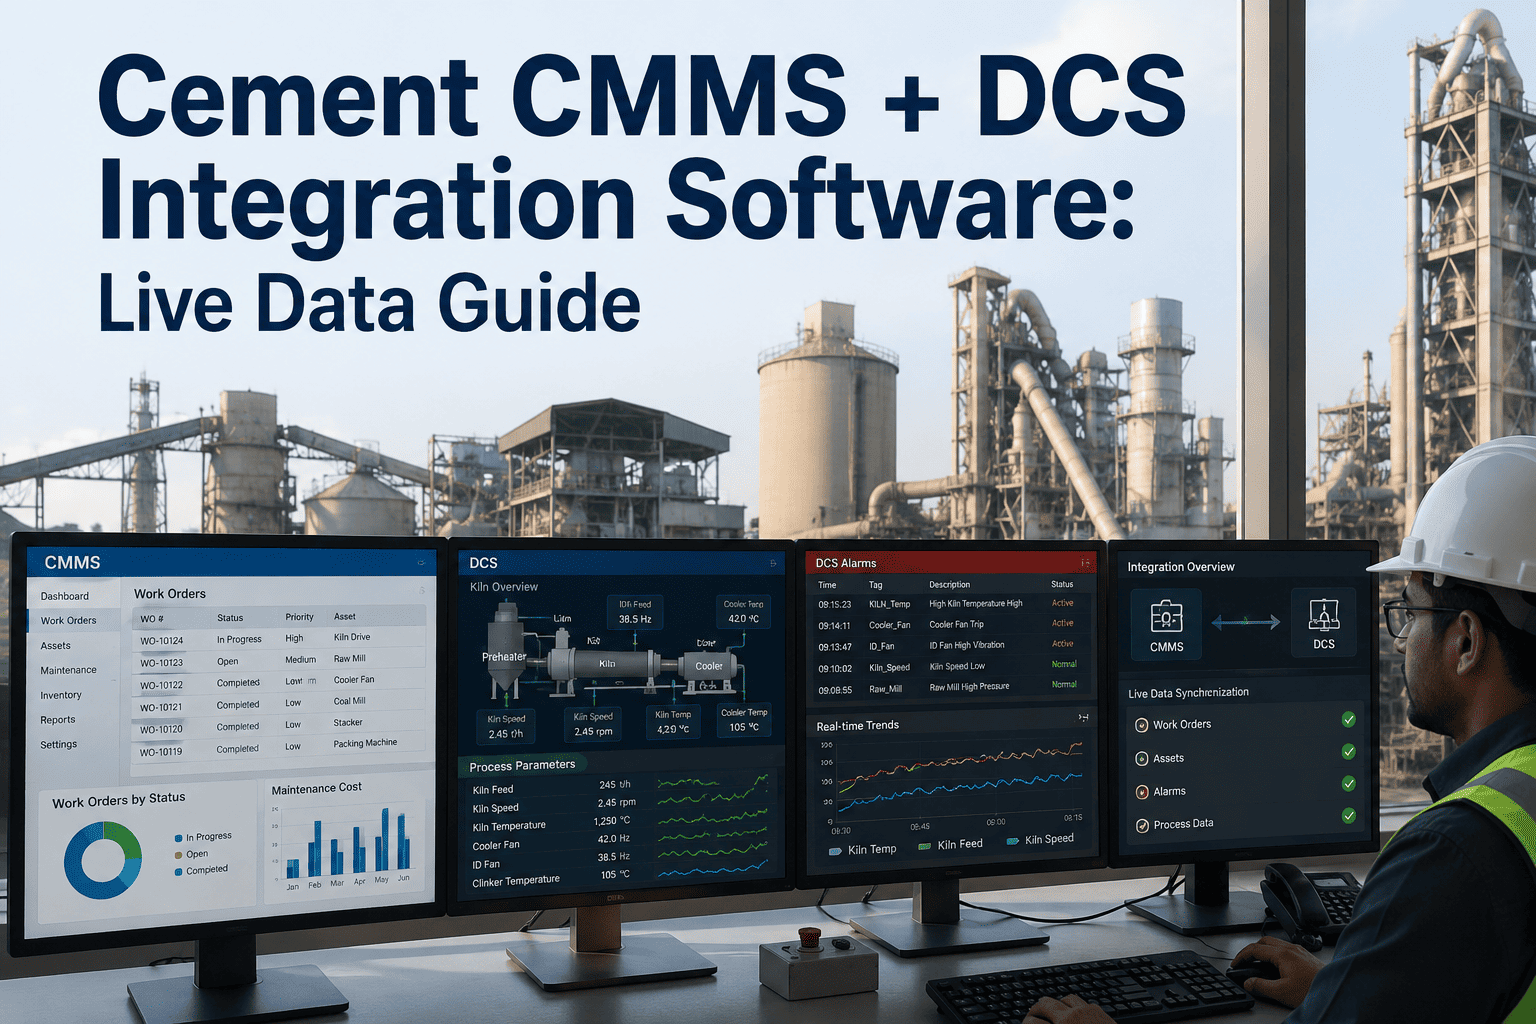
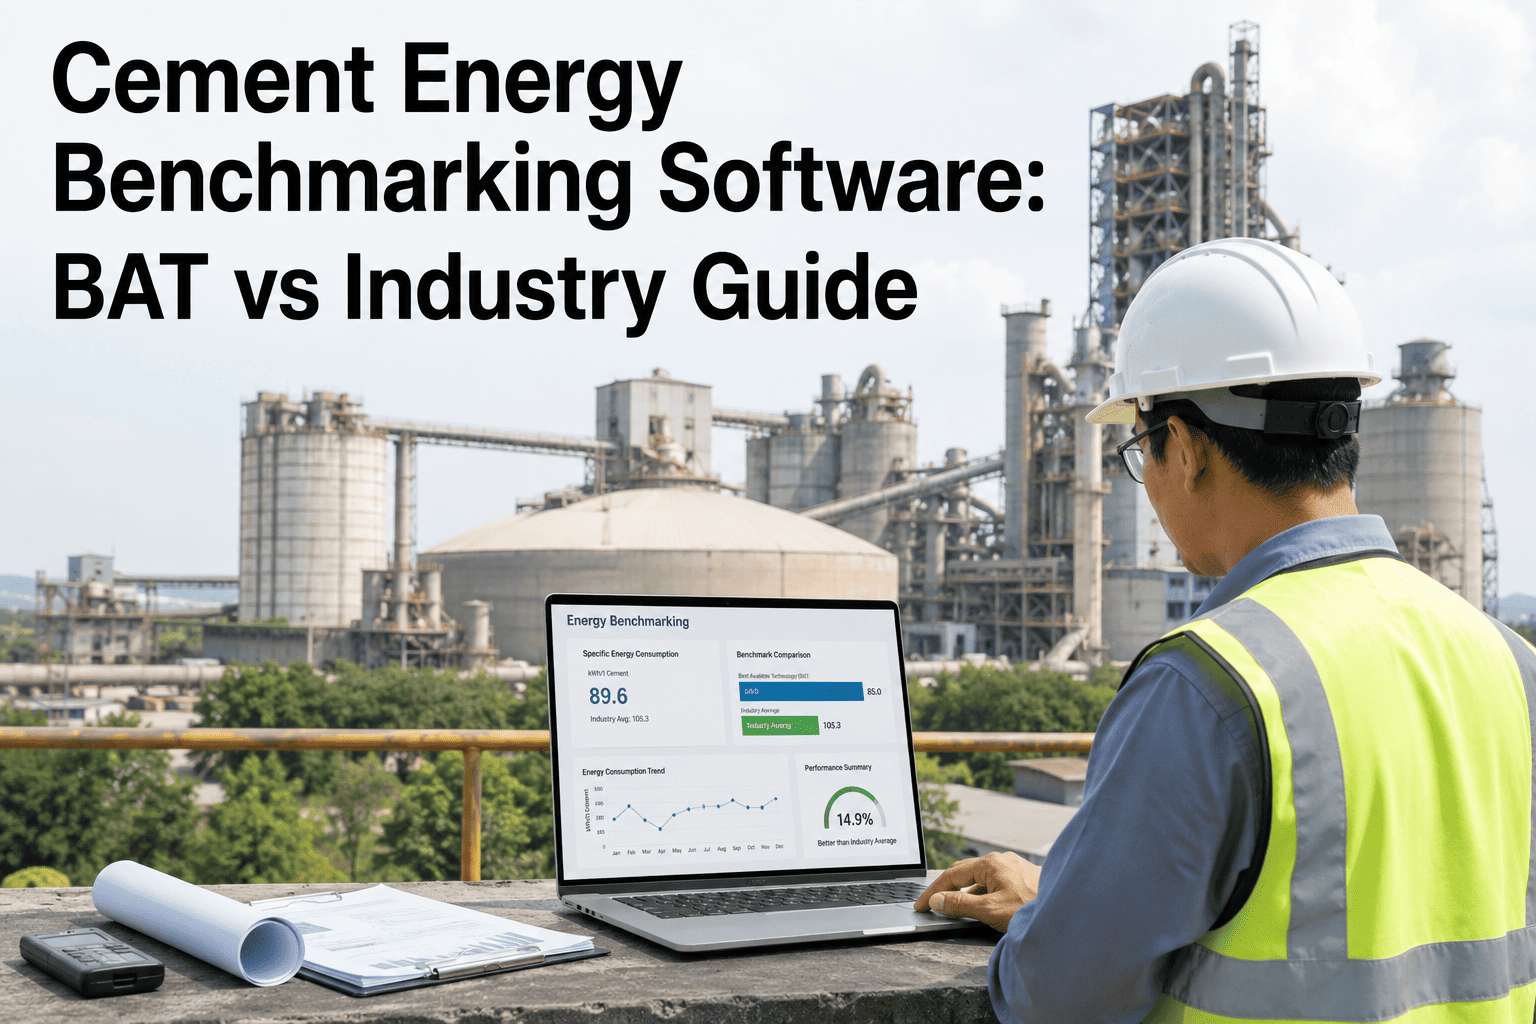
Looking for the best cement energy manager dashboard software in 2026? OxMaint delivers a purpose-built CMMS platform trusted by cement plants and heavy-industry operators worldwide. Our software helps energy managers track kWh, kcal, kVAR, and CO2 metrics across kilns, mills, and conveyors from one unified dashboard. With real-time monitoring, automated shift reporting, and IoT integrations, OxMaint eliminates manual spreadsheets and puts actionable energy intelligence at your fingertips. Whether you run a single plant or multi-site portfolio, OxMaint helps cut energy waste and stay audit-ready across every shift. Start your free trial or book a demo to see why leading operators choose OxMaint.
Energy Metrics That Cement Plant Managers Track Daily
Cement plants operate some of the most energy-intensive industrial processes on earth. These critical numbers define the daily challenge that energy managers face across every shift and production line. Monitoring them in real time is the first step toward controlling costs and achieving compliance.
Why Cement Plants Need Dedicated Energy Dashboards
Cement manufacturing ranks among the most energy-intensive industries on the planet, consuming roughly two to three percent of global industrial energy output. A single integrated cement plant burns thousands of tonnes of coal, petcoke, or natural gas daily while drawing megawatts of electrical power for raw grinding, pyroprocessing, finish grinding, conveying, and packaging operations. Without a centralized energy dashboard, plant managers rely on fragmented data scattered across SCADA historian logs, utility invoices, monthly production reports, and maintenance spreadsheets. This fragmented approach creates dangerous blind spots that cost millions annually in wasted energy, undetected equipment degradation, avoidable power factor penalties, and regulatory compliance failures.
A cement energy manager dashboard built on CMMS infrastructure bridges the critical gap between maintenance operations and energy optimization. When a kiln burner gradually degrades over weeks, thermal specific consumption creeps upward silently. When a roller mill bearing wears unevenly, electrical current spikes increase gradually. OxMaint's dashboard surfaces these trends alongside maintenance work orders so energy managers and reliability engineers collaborate from the same data source instead of working in disconnected silos.
The result is a closed-loop system where energy anomalies trigger maintenance actions and maintenance completions reflect immediately in energy performance charts. This integration separates a generic dashboard from a cement plant energy manager dashboard purpose-built for heavy continuous process industries. Plants deploying integrated energy-maintenance dashboards report fifteen to twenty-five percent faster anomaly resolution and eight to twelve percent reduction in energy cost per tonne within the first operating year. The compounding effect of connected energy and maintenance data accelerates savings with each quarter of operation as baselines refine and targets tighten.
Common Energy Management Challenges in Cement Plants
Cement plant energy managers face a unique set of challenges that make dedicated dashboard software essential rather than optional. Multiple energy sources including grid electricity, captive power, coal, petcoke, natural gas, and alternative fuels create complex consumption profiles that generic dashboards cannot disaggregate properly. Continuous process operations running around the clock across three shifts demand always-on monitoring rather than periodic manual reviews. Harsh operating environments with extreme dust, vibration, and temperature conditions cause sensor drift and communication failures that corrupt data quality over time.
Regulatory requirements for emissions reporting carry significant penalties for inaccuracies that make data integrity a business-critical concern. Multi-departmental energy cost allocation across grinding, pyroprocessing, and packing departments requires granular metering that spreadsheets cannot manage at scale. Seasonal demand variations and production mix changes shift energy consumption patterns in ways that static budgets cannot anticipate. Without a unified dashboard, responding to these challenges relies on individual experience and manual effort rather than systematic data-driven processes. OxMaint addresses every one of these challenges with a platform designed specifically for the operational reality of cement manufacturing environments.
Core Capabilities of OxMaint Cement Energy Dashboard
Energy KPI Tracking Matrix
The following table summarizes key performance indicators that cement plant energy managers track daily through the OxMaint dashboard. Each KPI connects directly to actionable maintenance triggers that reduce energy waste and improve operational reliability across every production shift.
| KPI | Unit | Typical Range | Best Target | Alert Threshold |
|---|---|---|---|---|
| Specific Electrical Energy | kWh/t cement | 60 - 110 | Below 75 | Above 90 |
| Specific Thermal Energy | GJ/t clinker | 3.0 - 4.5 | Below 3.3 | Above 3.8 |
| Power Factor | Ratio | 0.80 - 0.97 | Above 0.95 | Below 0.90 |
| CO2 Emission Rate | t/t clinker | 0.62 - 0.90 | Below 0.70 | Above 0.80 |
| Kiln Thermal Efficiency | Percent | 45 - 65 | Above 58 | Below 50 |
| Mill Specific Consumption | kWh/tonne | 25 - 45 | Below 30 | Above 38 |
| Compressor Specific Power | kW/100cfm | 15 - 25 | Below 18 | Above 22 |
| Alternative Fuel Rate | Percent | 0 - 60 | Above 30 | Below 15 |
Stop Losing Energy Savings to Fragmented Data
Fragmented energy data and delayed alerts cost cement plants millions annually. OxMaint gives your team real-time visibility across all four energy dimensions, automated shift reporting, and integrated maintenance triggers in one powerful CMMS platform. Join leading cement operators who have already transformed their energy management approach with OxMaint.
How OxMaint Cement Energy Dashboard Works
OxMaint deploys in five straightforward steps that connect your existing metering infrastructure to a powerful energy management dashboard without disrupting current operations. Each step builds on the previous one to create a complete closed-loop energy management system.
Before and After OxMaint Energy Dashboard
Before OxMaint
Energy data lives in utility bills reviewed monthly during management meetings. Shift supervisors manually track consumption on whiteboards and logbooks. Maintenance and energy teams use completely separate software systems with no data sharing. Consumption anomalies go undetected for weeks or months. Audit preparation consumes days of manual data gathering from multiple disconnected sources. Power factor penalties accumulate unnoticed until quarterly utility reviews reveal the damage. Thermal efficiency degrades without triggering timely alarms or adjustments.
After OxMaint
Real-time dashboard displays all four energy dimensions continuously across every active production line. Automated shift reports replace manual tracking with consistent data-driven records. Single integrated platform connects energy monitoring directly to maintenance execution workflows. Threshold alerts surface anomalies within minutes instead of weeks. One-click exports satisfy audit documentation requirements instantly. Power factor warnings trigger corrective capacitor bank actions before penalties accrue. Thermal efficiency trends drive proactive maintenance interventions that preserve equipment life.
Plants transitioning to OxMaint observe measurable improvements within the first operating quarter. Energy cost per tonne drops as awareness and accountability increase across all shifts. Maintenance responsiveness improves significantly because energy anomalies carry automatic work order context that eliminates communication delays. Compliance burden decreases because continuous automated logging replaces periodic manual reporting. These compounding benefits accelerate over subsequent quarters as historical baselines refine and optimization targets progressively tighten toward best-in-class performance levels.
Industry Energy Benchmarks and Targets
Understanding where your plant stands against industry benchmarks is essential for setting realistic improvement targets. The global cement industry average electrical energy consumption ranges between sixty and one hundred ten kilowatt-hours per tonne of cement produced. Thermal energy consumption typically falls between three and four point five gigajoules per tonne of clinker depending on process configuration and kiln technology vintage. Best-in-class plants achieve electrical consumption below seventy kilowatt-hours per tonne and thermal consumption below three point two gigajoules per tonne through systematic energy management and proactive maintenance practices.
OxMaint's dashboard plots your plant performance against these industry benchmarks so managers see exactly how much improvement potential exists and where to focus optimization efforts first for maximum return. Tracking progress against benchmarks over time creates accountability and momentum that sustains continuous improvement year after year. Plants that benchmark consistently outperform peers who rely on internal comparisons alone because external reference points reveal hidden improvement opportunities that internal trend analysis cannot expose.
Dashboard ROI and Business Impact
Investing in a cement energy manager dashboard delivers measurable financial returns that compound over time. Plants typically identify five to fifteen percent reduction in energy cost per tonne within the first year of dashboard deployment through improved visibility alone. Automated threshold alerting prevents energy waste events that previously went undetected for days, saving additional thousands per incident depending on the severity and duration of the anomaly. Integrated maintenance triggers reduce mean time to repair on energy-related equipment issues by twenty to forty percent compared to manual reporting workflows.
Power factor optimization through real-time kVAR monitoring eliminates utility penalties that can reach six figures annually for large cement plants operating with poor power factor. Audit preparation labor decreases by sixty to eighty percent when continuous automated logging replaces manual data collection from multiple disconnected systems. Across a typical five-year horizon, the cumulative return on investment for a cement energy manager dashboard like OxMaint exceeds three hundred percent when accounting for energy savings, penalty avoidance, maintenance efficiency gains, and compliance labor reduction. These returns justify the investment within the first two operating quarters for most plant configurations.
Who Benefits from Cement Energy Dashboard Software
Frequently Asked Questions
What energy metrics does OxMaint cement energy dashboard track?
Can OxMaint integrate with existing plant metering and SCADA systems?
How does the dashboard connect energy anomalies to maintenance actions?
Is OxMaint suitable for multi-site cement operations?
Does OxMaint help with ISO 50001 energy management compliance?
Transform Your Cement Plant Energy Management Today
Ready to eliminate energy blind spots and take control of your plant energy performance? OxMaint delivers the real-time visibility, automated alerts, and integrated maintenance triggers that leading cement operators depend on to cut energy costs, reduce emissions, and optimize asset performance across every shift. See the difference a purpose-built cement energy manager dashboard makes for your operation.